Metrics explained Metric 'Token Age Consumed' For a more in-depth explanation of 'Token Age Consumed', please click here.
For a video breakdown of 'Token Age Consumed' and 'Average Token Age Consumed in Days', click here.
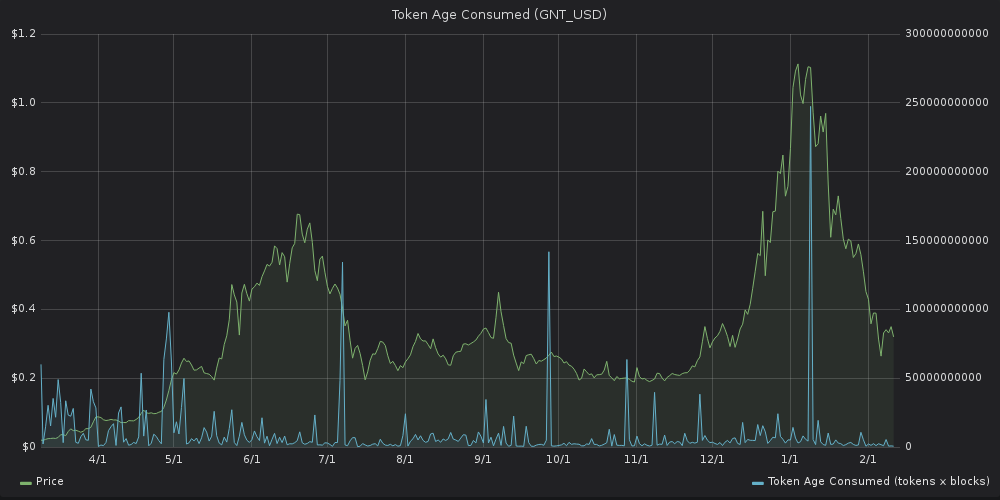
This graph shows the amount of tokens changing addresses on a certain date, multiplied by the number of blocks created on the blockchain since they last moved.
Spikes on the graph signal a large amount of tokens moving after being idle for an extended period of time.
One potential use case for this metric is identifying when big market players exit the project post ICO. Let’s look at an example:
Here’s the Token Age Consumed graph for Golem, an ERC-20 project that lets you rent other people’s computing power.
We can easily spot several significant spikes over time: each could be a large early investor selling their tokens, which commonly results in a parallel price decline.
For more details on the metric 'Average Token Age Consumed in Days', please click here.