\[ \newcommand{\var}[1]{\mathrm{#1}} \]
If we compare the current market capitalization (market value or MV) to the current Realized Value, we can get an estimate how overvalued or undervalued the current market cap is. The definition will be:
\[ MVRV = \frac{MV}{RV_{network}}\]
Example: if the current realized value is $4b and the market value is $8b, that means that on average each participant will take 2x profits if he liquidates his tokens. The more this ratio increases, the more people will be willing to sell and take profits.
If the MVRV is below 1, then the market is “undervalued” on average, meaning most people will be realizing losses if they sell their holdings.
Keep in mind that this is in the ideal case and does not account for the addresses with lost private keys. The way to adjust for this is to look at the historical values for the MVRV ratio. As the ratio is approaching historical maximums or minimums, then the possibility of a highly overvalued or undervalued market is much higher.
To understand the MVRV metrics, we have to establish two term. ‘MV’ as in ‘market value’ simply describes the market cap, which is well known when looking at crypto assets. The second part is the ‘RV’ or ‘realized value’.
The metric depends on:
The realized value metric is calculating the acquisition cost of the assets located in a wallet. Imagine that there is a wallet which has 30 tokens and these tokens came into the wallet in 3 transactions:
The realized value of the address is:
\[ 10 \times 5 + 5 \times 15 + 15 \times 10 = 50 + 75 + 150 = 275 \]
This number gives the value of the tokens for this particular token holder and can be compared to the current market value. If the current price of the token is below $9.1, then the money this holder paid for acquiring these assets are more than their current value, while if the price is over $9.1, the value is greater. That means that if the current price is $10, these tokens are worth $300 and if the holder sells everything, he will get $25 profit.
The interesting part is that we can compute the realized value across the whole network, by summing the realized values of all wallets holding tokens at the moment. This number gives an estimate of the amount of money the users of the network spend to acquire their assets. The definition will be:
\[ RV_{network}= \sum_{a \in addresses} RV(a) \]
Time Bound MVRV means the average potential profit/loss that investors who acquired the coin in the last X days will realize if they all sell at current price. It is calculated as daily closing price over mean realized price. In order mean realized price is calculated as stack realized cap over stack circulation.
For example 7 days MVRV is calculated:
\[ MVRV_{7 days} = \frac{daily\;closing\;price}{mean\; realized\; price\;_{7days}} \]
when
\[ mean\; realized\; price_{7 days} = \frac{stack\;realized\;cap\;_{7days}}{stack\;circulation\;_{7days}} \]
The metric is available for next time bounds: 1d | 7d | 30d | 60d | 90d | 180d | 365d | 2y | 3y | 5y | 10y | 20y
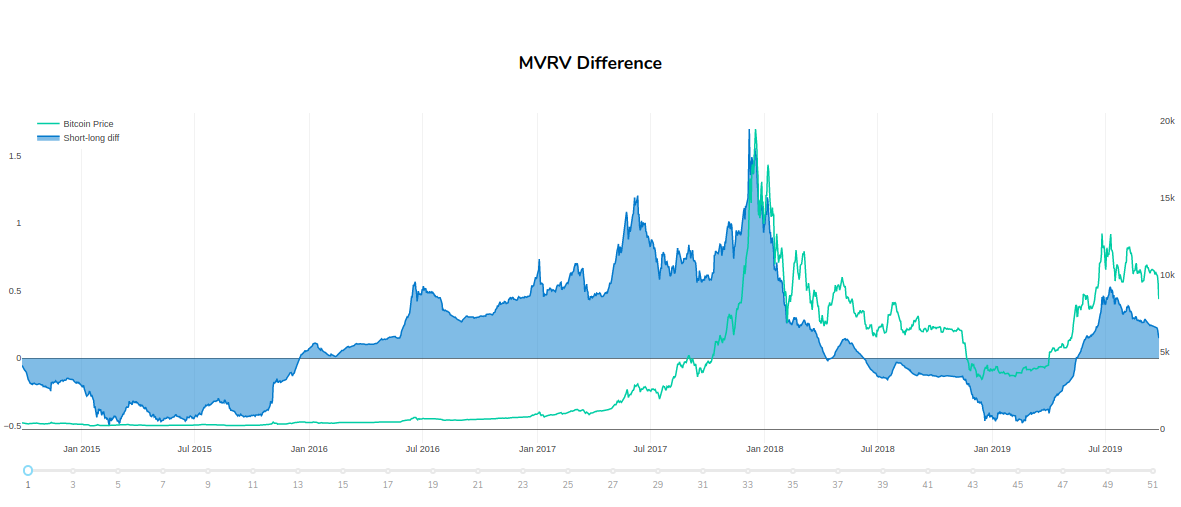
The MVRV difference shows the contrast between the MVRV ratios of coins that have moved in 2 different time frames: long one, 30 days for example, and 2 years.
Percent
One value is computed for each day and each asset. The day is taken according to the UTC timezone.
The computation starts around 00:30 UTC each day. The final value of this metric is generally available around 00:40 UTC.
Note: Since our Bitcoin latency is generally larger than 30 minutes and can go up to 2 hours, the value computed at 00:30 UTC might not be final. In that case the value computed at 6:30 UTC will be final.
For most assets latency is around 40 minutes. For Bitcoin the latency for the final value is usually 6 hours and 40 minutes. At 00:40 UTC you will get an approximate value which will exclude data in the last up to 3 blocks.
This metric is computed for Bitcoin, Ethereum, Ripple, all ERC20 tokens and the main EOS token.
You can access the metric on the On-chain metrics V2
Dashboard is available with Pro plan in Graphs *
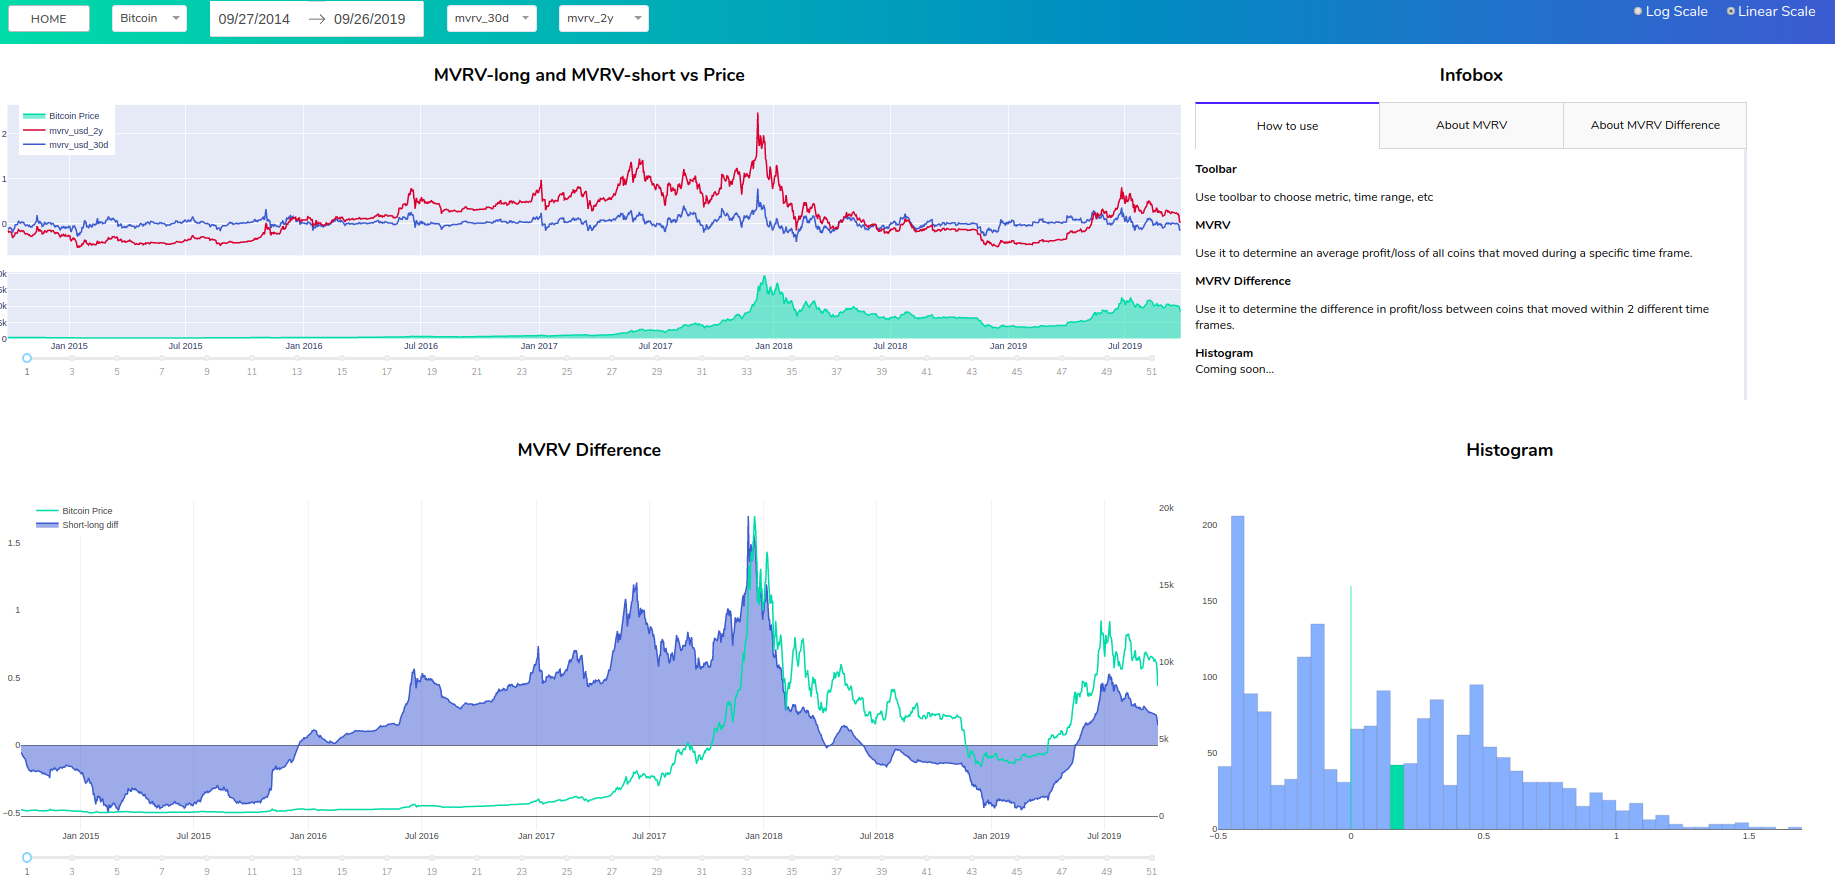
* curently available only for Bitcoin
The metric is available on our charts:

The metric is available on SanAPI. It’s available for all time bounds represented in Time Bound MVRV section, i.e. 1d, 7d, 30d, etc.
Check full list of available metrics using query:
Example of query for mvrv_usd:
{
    getMetric(metric: "mvrv_usd") {
        timeseriesData(slug: "santiment", from: "2019-01-01T00:00:00Z", to: "2019-09-01T00:00:00Z", interval: "7d") {
            datetime
            value
        }
    }
}Example of query for time bound MVRV:
{
    getMetric(metric:"mvrv_usd_7d") {
    timeseriesData(slug:"santiment", from:"2019-01-01T00:00:00Z", to:"2019-09-01T00:00:00Z", interval:"7d") {
      datetime
      value
    }
  }
}Example of query for mvrv long-short difference:
{
    getMetric(metric:"mvrv_long_short_diff_usd") {
    timeseriesData(slug:"santiment", from:"2019-01-01T00:00:00Z", to:"2019-09-01T00:00:00Z", interval:"7d") {
      datetime
      value
    }
  }
}
Currently available only for MVRV ratio. You can use SAN_MVRV_RATIO function to get the data. Example:
=SAN_MVRV_RATIO("santiment", DATE(2019,5,1), DATE(2019,5,31))MVRV
| Free | Basic | Pro | Premium | Enterprise | |
|---|---|---|---|---|---|
| Sanbase | ✅ | ✅ | ✅ | ✅ | ✅ |
| Sanbase Graphs | ❌ | ✅ | ✅ | ✅ | ✅ |
| Sandata | ❌ | ✅ | ✅ | ✅ | ✅ |
| SanAPI | ❌ | ❌ | ✅ | ✅ | ✅ |
| Sansheets | ❌ | ✅ | ✅ | ✅ | ✅ |
Time Bound MVRV
| Free | Basic | Pro | Premium | Enterprise | |
|---|---|---|---|---|---|
| Sanbase | ✅ | ✅ | ✅ | ✅ | ✅ |
| Sanbase Graphs | ❌ | ✅ | ✅ | ✅ | ✅ |
| Sandata | ❌ | ❌ | ❌ | ❌ | ❌ |
| SanAPI | ❌ | ❌ | ✅ | ✅ | ✅ |
| Sansheets | ❌ | ❌ | ❌ | ❌ | ❌ |
MVRV Difference
| Free | Basic | Pro | Premium | Enterprise | |
|---|---|---|---|---|---|
| Sanbase | ❌ | ❌ | ❌ | ❌ | ❌ |
| Sanbase Graphs | ❌ | ✅ | ✅ | ✅ | ✅ |
| Sandata | ❌ | ✅ | ✅ | ✅ | ✅ |
| SanAPI | ❌ | ❌ | ✅ | ✅ | ✅ |
| Sansheets | ❌ | ❌ | ❌ | ❌ | ❌ |
The metric can have additional restrictions. Check the restrictions in access plans article